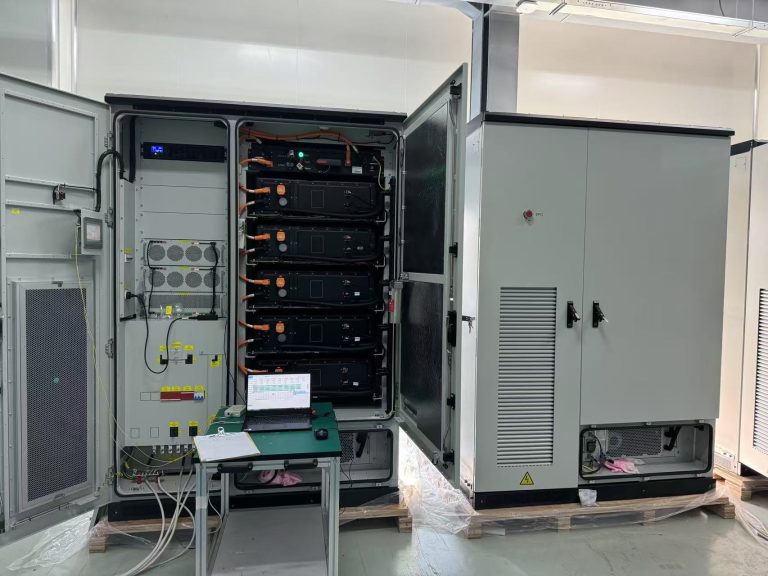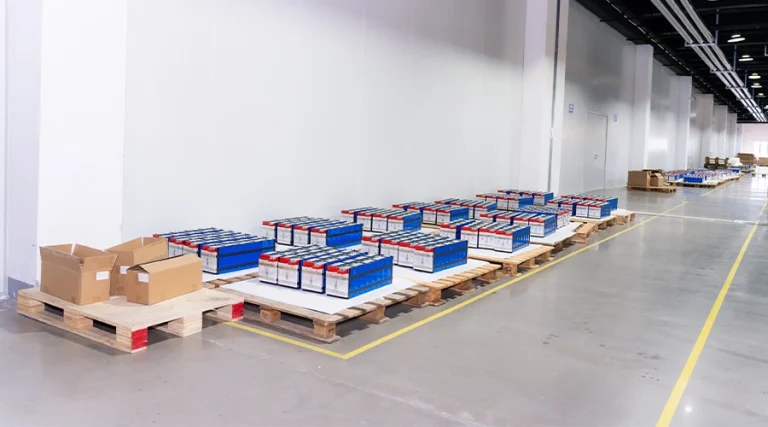
BESS round trip efficiency is the energy returned during discharge divided by the energy used to charge the system across a stated measurement boundary. A result without that boundary is incomplete. Battery cells, power electronics, transformers, cables, cooling and standby loads can all change the number, and two suppliers may report different values for the same physical system simply because they measured at different points.
BESS Round Trip Efficiency in One Formula
Round-trip efficiency (%) = AC energy discharged / AC energy charged x 100. If a system receives 1,000 kWh at the point of connection and later returns 860 kWh at the same point, its measured AC-to-AC efficiency is 86%. The missing 140 kWh became conversion loss, battery heat, auxiliary consumption and electrical loss.
| Measurement basis | Charge meter | Discharge meter | What it includes |
| DC-to-DC | Battery DC terminals | Battery DC terminals | Cell and internal DC losses |
| AC-to-AC at PCS | PCS AC terminals | PCS AC terminals | Battery plus PCS conversion |
| Point of connection | Site/grid meter | Same site/grid meter | Battery, PCS, transformer, cables and auxiliaries |
Why the Measurement Boundary Changes the Answer
A battery data sheet may report DC efficiency under controlled temperature and power. A project owner pays for energy at the AC meter. Between those points sit the PCS, transformer, switchgear, cable runs and auxiliary loads. This is why an 89% battery-plus-PCS claim cannot be compared directly with an 85% point-of-connection test.
The test plan should name the meters, meter accuracy, sampling interval, starting and ending SOC, charge/discharge power, rest periods, ambient temperature and treatment of auxiliary energy. Without those details, a percentage is a sales number rather than a repeatable performance result.
Where Energy Is Lost in a BESS
To understand the overall round-trip efficiency, it helps to trace where energy is lost as it moves through the system. The main loss sources are the battery cells and racks, the PCS, transformers and cabling, and the cooling, control, and standby systems.
Battery cell and rack losses
Current moving through cells, busbars and connectors creates heat. Loss rises with current, so efficiency at 0.25C may not match efficiency at 0.75C. Cell balancing also consumes or redirects small amounts of energy. Cold or hot conditions can increase resistance and trigger extra thermal-management work.
PCS conversion losses
The PCS switches power between DC and AC. Its efficiency follows a curve rather than one fixed number. A unit may perform well near its preferred load but lose a larger share at very low power. A lightly loaded oversized PCS can therefore hurt annual energy efficiency even if its peak efficiency looks strong.
Transformer cable and switchgear losses
Transformer core loss continues whenever the transformer is energized. Copper loss changes with current. Long cable runs add resistance, and connections add smaller losses. These items may look minor in isolation, but they sit outside many battery or PCS efficiency figures.
Cooling controls and standby loads
Fans, pumps, HVAC, fire panels, controllers and network equipment draw energy whether the battery is moving power or waiting. In a high-throughput application, auxiliaries are a small share of total energy. In a system that cycles briefly or sits idle for long periods, standby consumption can dominate the annual loss.
A Practical Round Trip Efficiency Example
A commercial BESS takes 1,200 kWh from the AC bus during charging. During the later discharge window, the AC meter records 1,044 kWh returned. The AC-to-AC round-trip efficiency is 1,044 / 1,200 = 87%.
| Energy item | Value | Share of input |
| AC charging energy | 1,200 kWh | 100% |
| Battery and DC losses | 48 kWh | 4% |
| PCS conversion loss | 60 kWh | 5% |
| Transformer and cable loss | 18 kWh | 1.5% |
| Cooling and controls | 30 kWh | 2.5% |
| AC discharge energy | 1,044 kWh | 87% |
This is an illustrative balance, not a universal loss split. Real results change with power level, temperature, SOC window, system age and test duration. The useful lesson is the accounting: every kWh must be assigned to delivered output, stored-energy change or a named loss.
How to Measure BESS Efficiency on Site
Choose one measurement boundary and use the same meter location for charge and discharge.
Bring the system to a recorded starting SOC and stable temperature.
Charge at the agreed power until the upper SOC limit is reached.
Apply the agreed rest period, then discharge at the test power.
Stop at the stated lower SOC limit and record auxiliary energy.
Repeat when needed and report meter uncertainty and operating conditions.
If starting and ending SOC differ, the test has borrowed or left energy in the battery. The result needs an SOC correction or a repeat test. Site acceptance teams should also check whether the EMS curtailed power, whether the BMS applied a limit, and whether the PCS operated in reactive-power mode.
How Operating Strategy Affects Annual Efficiency
A nameplate efficiency test is useful, but annual performance follows dispatch. Shallow cycles at low PCS loading, long standby periods and frequent thermal conditioning may produce a lower annual figure. A project model should use an efficiency curve or several operating points rather than one peak value.
For peak shaving, the battery may discharge for only 30 to 90 minutes on selected days. For solar load shifting, it may process a larger energy volume almost every day. These duty cycles produce different auxiliary-loss shares and different warranty throughput. The earlier guide to battery storage duration from interval load data provides the sizing context.
Turning Efficiency into an Annual Energy Estimate
Suppose a site plans to discharge 800 kWh on 220 working days. The annual delivered energy target is 176,000 kWh. At 88% round-trip efficiency, charging that output requires about 200,000 kWh before separate standby consumption. If the system draws an average 2 kW while available for 8,760 hours, standby energy adds 17,520 kWh. The annual purchase is therefore closer to 217,520 kWh, not 200,000 kWh.
That difference changes both savings and charging capacity. A midday solar window may have enough surplus for the theoretical cycle but not for auxiliaries and weather variation. The EMS may also hold reserve SOC for backup, leaving less energy for price arbitrage. Financial models should therefore use interval dispatch, measured auxiliary load and a seasonal efficiency assumption rather than multiplying nameplate kWh by a single brochure percentage.
Performance guarantees need the same care. A contract can state a minimum AC-to-AC efficiency at defined power, temperature and SOC limits, plus a separate cap or reporting rule for auxiliaries. If the project operates outside that test window, the owner still needs an annual KPI that shows energy in, energy out, throughput, average power and hours energized.
LIB System Advantages for Efficient Operation
Lithium iron phosphate storage supports frequent cycling with modular battery racks, BMS monitoring and a controllable SOC window. Efficiency still depends on the complete design. Buyers should request figures that match the planned measurement boundary and duty cycle.
| Specification | Ask for | Reason |
| Efficiency | DC, PCS AC and point-of-connection values | Makes bids comparable |
| Power points | Efficiency at low, medium and rated load | Reflects real dispatch |
| Auxiliary load | Running and standby consumption | Improves annual model |
| Temperature range | Test condition and derating behavior | Shows climate effect |
| SOC window | Usable limits and reserve policy | Defines available energy |
| Metering | Class, location and data interval | Supports acceptance testing |
HITEKESS offers commercial energy storage solutions and publishes guidance on containerized battery energy storage systems. Project specifications should state the efficiency boundary before suppliers submit guaranteed values.
Efficiency Claims Buyers Should Question
A percentage with no AC or DC measurement boundary
Peak PCS efficiency presented as whole-system round-trip efficiency
A test that excludes cooling and control loads without saying so
Results measured at different starting and ending SOC
A single value with no power level or temperature
An annual savings model that ignores standby consumption
Вывод
BESS round trip efficiency is useful only when the measurement boundary and test conditions are clear. Start with energy charged and discharged at the same meter, then account for battery, PCS, transformer, cable and auxiliary losses. For procurement, compare bids on one agreed basis. For commissioning, record SOC, power, temperature, meter accuracy and auxiliary consumption. That creates a result the owner can repeat and use in the financial model.
Часто задаваемые вопросы
What is a good BESS round trip efficiency?
There is no single pass value for every project. Compare systems at the same AC or DC boundary, power level, temperature and SOC window, then test against the contracted guarantee.
Is PCS efficiency the same as BESS round trip efficiency?
No. PCS efficiency covers power conversion. BESS round-trip efficiency can also include battery losses, transformers, cables, cooling and controls.
Why does round trip efficiency fall at low power?
Fixed standby and auxiliary loads become a larger share of the smaller energy flow, and the PCS may operate away from its best efficiency point.
Should HVAC energy be included in BESS efficiency?
Include it when measuring at the site point of connection. If a supplier excludes HVAC, the report should state that exclusion and provide the auxiliary consumption separately.
How often should BESS efficiency be tested?
Test during commissioning and repeat according to the performance-guarantee or maintenance plan. A repeat test is also useful after major repairs or a clear change in operating performance.
Project teams can send efficiency and duty-cycle requirements through the HITEKESS contact page.
HITEKESS HIGH QUALITY BESS STORAGE SYSTEMS
- Renewable Energy Hitek Best 250kw Inverter off Grid on Grid Hybrid 50kw 100kw 150 Kw 250kw Complete Solar Power System Cost All in One Solar Panels System
Model: HT250KW-HY
- Hitek 1mwh 2mwh 3mwh 20FT 40FT Bess Container Commercial Solar Container System Mobile Solar Power Unit Emergency Solar Container for Disaster Relief
Model: HT20FT-500kW/1MWh-EC
- Renewable Solar Photovoltaic System 500kw 1mwh Hybrid Grid Connected off Grid Solar Power Energy Storage Emergency Backup Bess 100kw 150kw 200kw 250kw 500kw
Модель: HT500KW-HY
- Hitek 50kw 100kw Industrial Commercial Energy Storage Systems Factory Bess Outdoor Battery Cabinet 200kwh 229kwh High-Voltage LFP Battery Cabinets BMS
Модель: HTAC-100/200-OD
- Hitek отключить сетевую солнечную энергетическую систему 60кВт 100кВт 120кВт 200кВт 250кВт 300кВт 400ВАК Гибридная система хранения энергии солнечной батареи Bess с батареей LiFePO4 200кВт 500кВт
Модель: HTCI-100KW/200KWh
- Hitek Все в одном от сети 50 кВт 100 кВт 150 кВт 200 кВт 250 кВт 500 кВт Bess Солнечная батарея Система хранения энергии 1 МВт Гибридная солнечная система с распределенным кабинетом батареи
Модель: HT-100/200-OC